Writing
Articles and how-tos from some of my personal projects
-

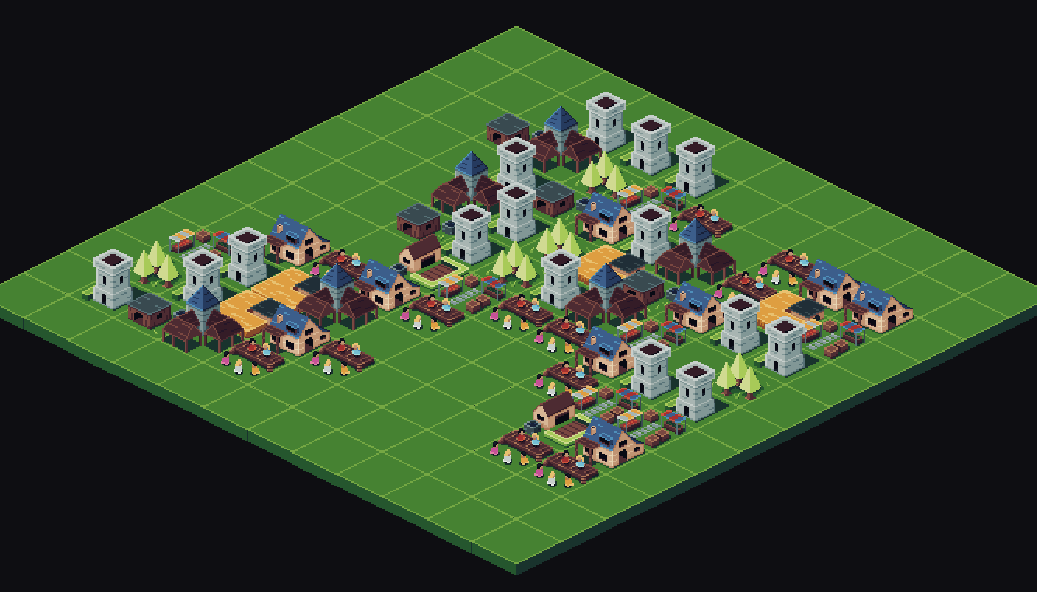
Playing with cellular automaton
Exploring applications of cellular automata beyond the game of life
-
Why use a ternary plot?
A bar chart might be better, maybe
-
How are London's bus routes connected?
A network analysis exploring the connections between bus routes in Greater London
-
Scribbled lines in WebGL
Converting images to scribbled drawings using WebGL
-
Writing a WebGL Shader
Getting started with WebGL Shaders using three.js and GLSL
-
Creating a graph builder in Next.js
How I built GRAPHIX, a web app to create and share interactive data visualisations
-

Supervised machine learning for text analysis
Classifying objects at the London Science Museum using R and tidymodels
-
3D mapping with rayshader and three.js
Recreating China's Jade Snow Mountain with R and React
-
Animating data visualisations in React
Animated visualisations with visx and Framer Motion
-
Data visualisation in React
Getting started with visx, a data visualisation library from Airbnb
-
Faceting charts with visx and CSS grid
How to create faceted line charts
-
Network analysis in R
Exploring internal migration in the UK using ggraph


