Hey, I'm Owen King.
I'm a quantitative analyst and software developer. I use modern technology to analyse data, generate insights, communicate trends and create new products.
Learn more about meSome things I've created recently
A network analysis of London bus routes. An interactive exploring the connections between bus routes in Greater London. Based on data from TFL, the visuals show the most (and least) connected routes in the capital’s transport network. Check it out here.
A low poly interactive made with react-three/rapier. An interactive scene made from a GLTF file using react-three/rapier and use-gesture (for the touch controls). The orthographic camera makes makes the scene pop nicely. Check it out here.
Multiplayer three.js with PartyKit. A multiplayer emoji painter made with PartyKit and three.js decal geometries. Try it out here (best enjoyed with friends) or view the server and client code on GitHub.
Turning GLTF files into line drawings. A sketch made by sampling points from a GLTF file and then connecting them with three.js line segments.
Twisting a cuboid with WebGL. Using a WebGL shader to contort a cuboid into a wobbly torus. Inspired by Daniel Velasquez’s newsletter issue on vertex shader displacement, and Yuri Artiukh’s article on twisted typography.
An AI tool for data visualisation. An experimental app that wires up OpenAI’s function calling API to the World Bank’s data, allowing users to simply describe what data they want to see and create interactive dashboards in seconds.
Writing
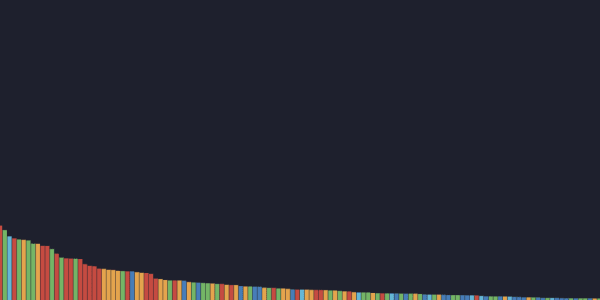
Why use a ternary plot?
A bar chart might be better, maybe
How are London's bus routes connected?
A network analysis exploring the connections between bus routes in Greater London
Scribbled lines in WebGL
Converting images to scribbled drawings using WebGL
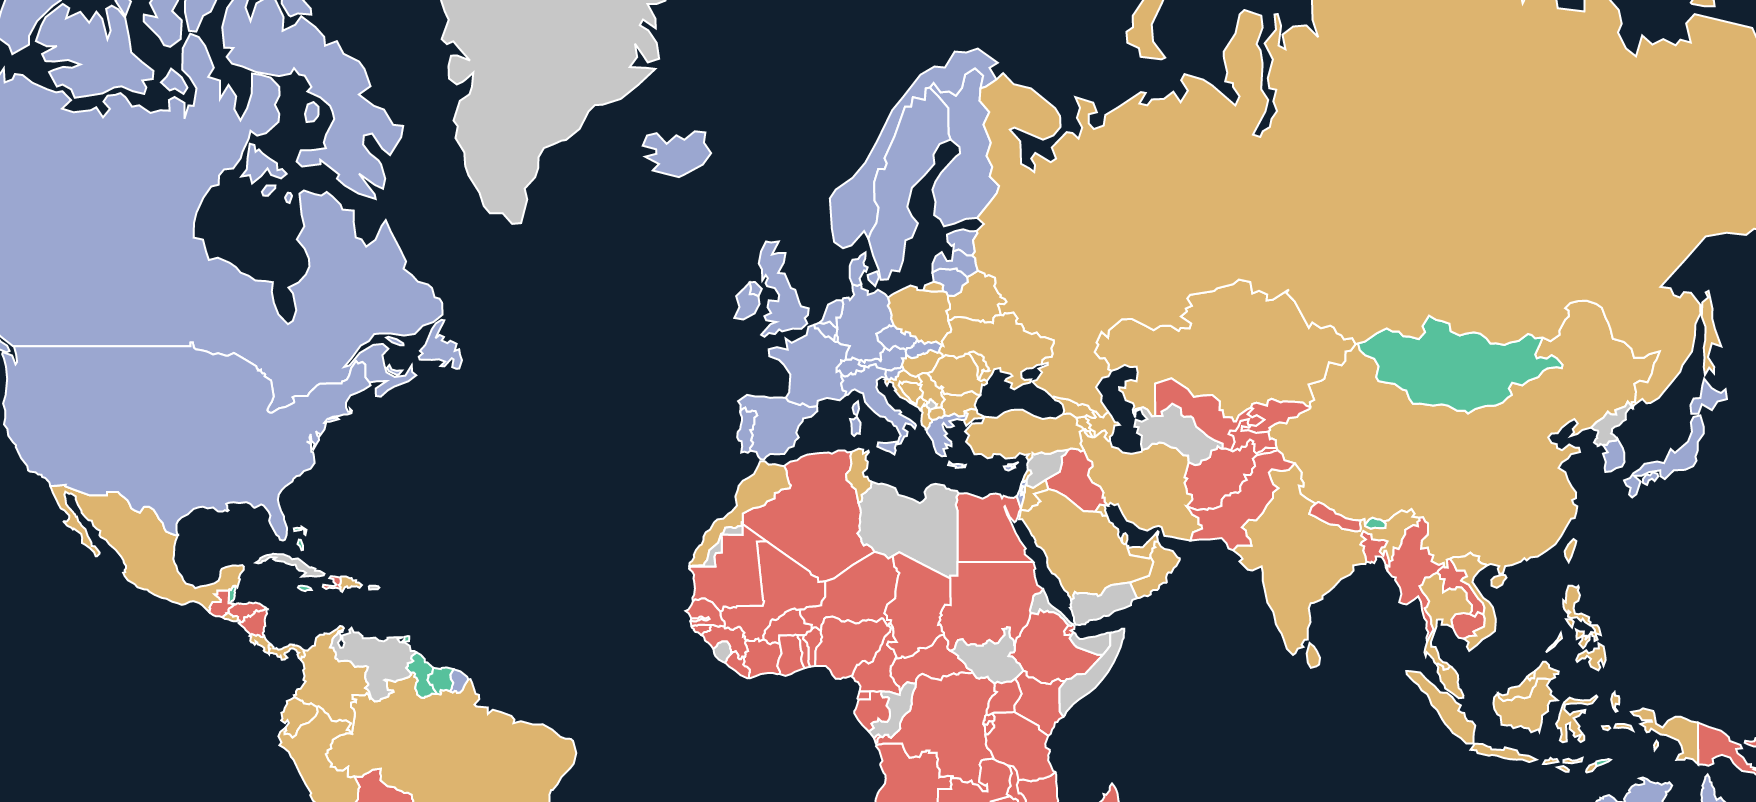
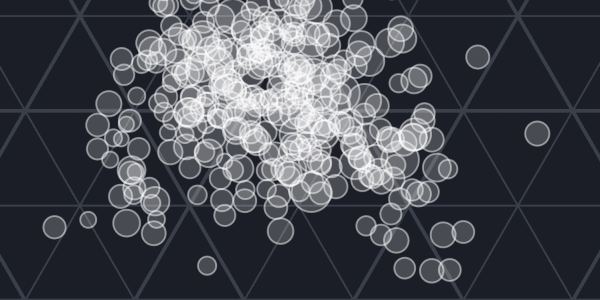
Clustering countries with PCA and k-means
How to group countries using R and tidymodels
Writing a WebGL Shader
Getting started with WebGL Shaders using three.js and GLSL
Creating a graph builder in Next.js
How I built GRAPHIX, a web app to create and share interactive data visualisations